
Technical Design & Hydraulic Engineering
A structured technical overview covering siphonic pressure behaviour, system design criteria, project simulation, design rainfall, effective roof catchment, rainwater runoff and gutter capacity design.
Cavitation, Positive and Negative Pressures
The siphonic system must be designed around pressure behaviour as the pipework becomes fully primed.
The source technical page emphasises the importance of controlling negative pressure and avoiding cavitation.
As rainfall intensity increases, the pipework fills with water. Once the Chezy outlets are submerged below the water level in the gutter, the outlet design prevents air from entering the pipework and the system becomes fully primed.
At the roof or podium outlet, atmospheric pressure is present at the rainwater surface. As water moves through changing pipe sizes, energy is conserved according to Bernoulli’s theorem, producing changes in velocity and pressure along the flow path. The source states that the highest negative pressure is generally found at the top of the vertical downpipe, creating the suction effect associated with higher siphonic flow rates.
High negative pressures may deform or buckle pipework. The source design criteria state that the system should not have a negative pressure exceeding −8 m head of water.
In tall buildings, pressure may approach the vapour pressure of water, allowing water vapour cavities to form. This is described as cavitation. The technical page notes that cavitation can cause turbulence, pressure fluctuations and damaging impact pressures when vapour cavities collapse. Chezy’s design software is described as checking pipe sizes for this condition.
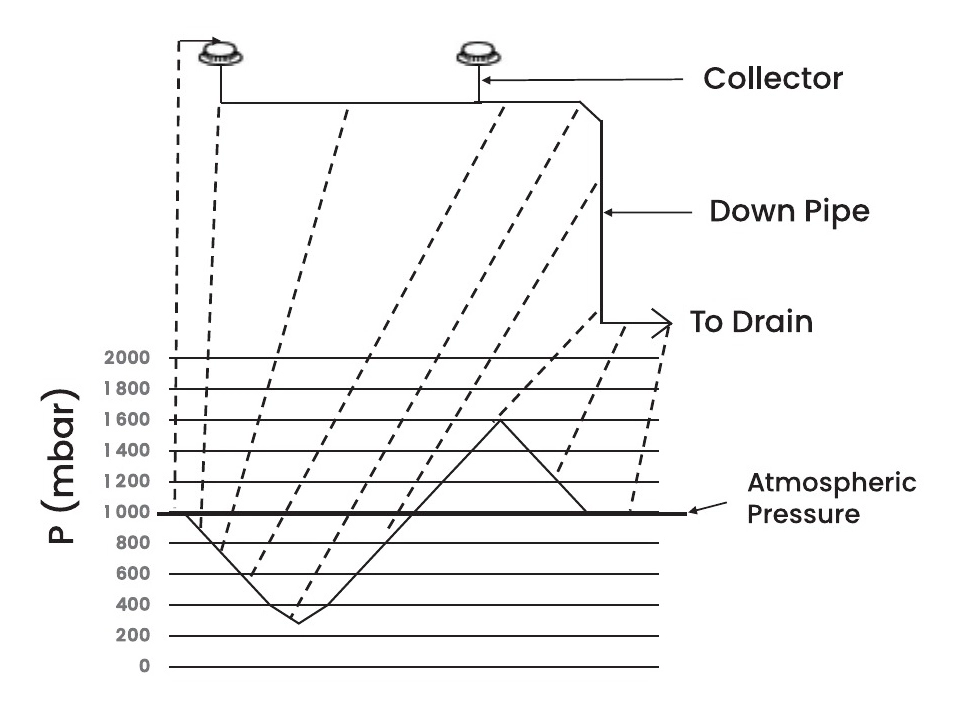
Normal Pressure Variations In a High Rise Siphonic System
Chezy Siphonic Rainwater DischargeSystem Design Process
The supplied design-process page sets out eight engineering steps from identifying exposed roof areas through software simulation and standards compliance.
Identify Exposed Roof Areas
Review architectural AutoCAD drawings to identify exposed roof surfaces contributing to rainwater collection.
Calculate Roof Catchment Area
Measure and calculate the total exposed roof area and other contributing areas in square metres.
Determine Rainfall Intensity
Refer to MSMA 2nd Edition 2012 to determine design rainfall intensity for the project geographical location.
Calculate Design Flow Rate
Use the source formula Q (L/s) = A (m²) × RFI (mm/hr) ÷ 3600 to calculate peak design flow.
Select Collector Size & Quantity
Plan Pipe Routing
Simulate the System
Comply with Design Standards
Design Software, Hydraulic Checks & Engineering Criteria
The supplied capability page states that Chezy uses German design software and provides pipe routing, schematic drawings, collector placement and hydraulic calculations for the complete system.
What the Software Evaluates
- Flow rates along individual flow paths
- Water velocities throughout the system
- Static pressure along the flow paths
- Pipe sizes and fittings in the building layout
- Collector positioning and quantity
- System efficiency and hydraulic performance
Design Rules Stated in the Source
- Pipe roughness value: 0.025 (dimensionless).
- Run-off design rates increased by 10% as a safety factor and for possible partial outlet clogging.
- Minimum velocity in tailpipes and horizontal sections longer than 1 m: 1.0 m/s.
- Minimum velocity in vertical downpipes: 2.2 m/s.
- Maximum filling time to full siphonic state: 60 seconds.
- Pressure should not be lower than −8 m water head below atmospheric pressure.
Hydraulic Project Layout & Performance Verification
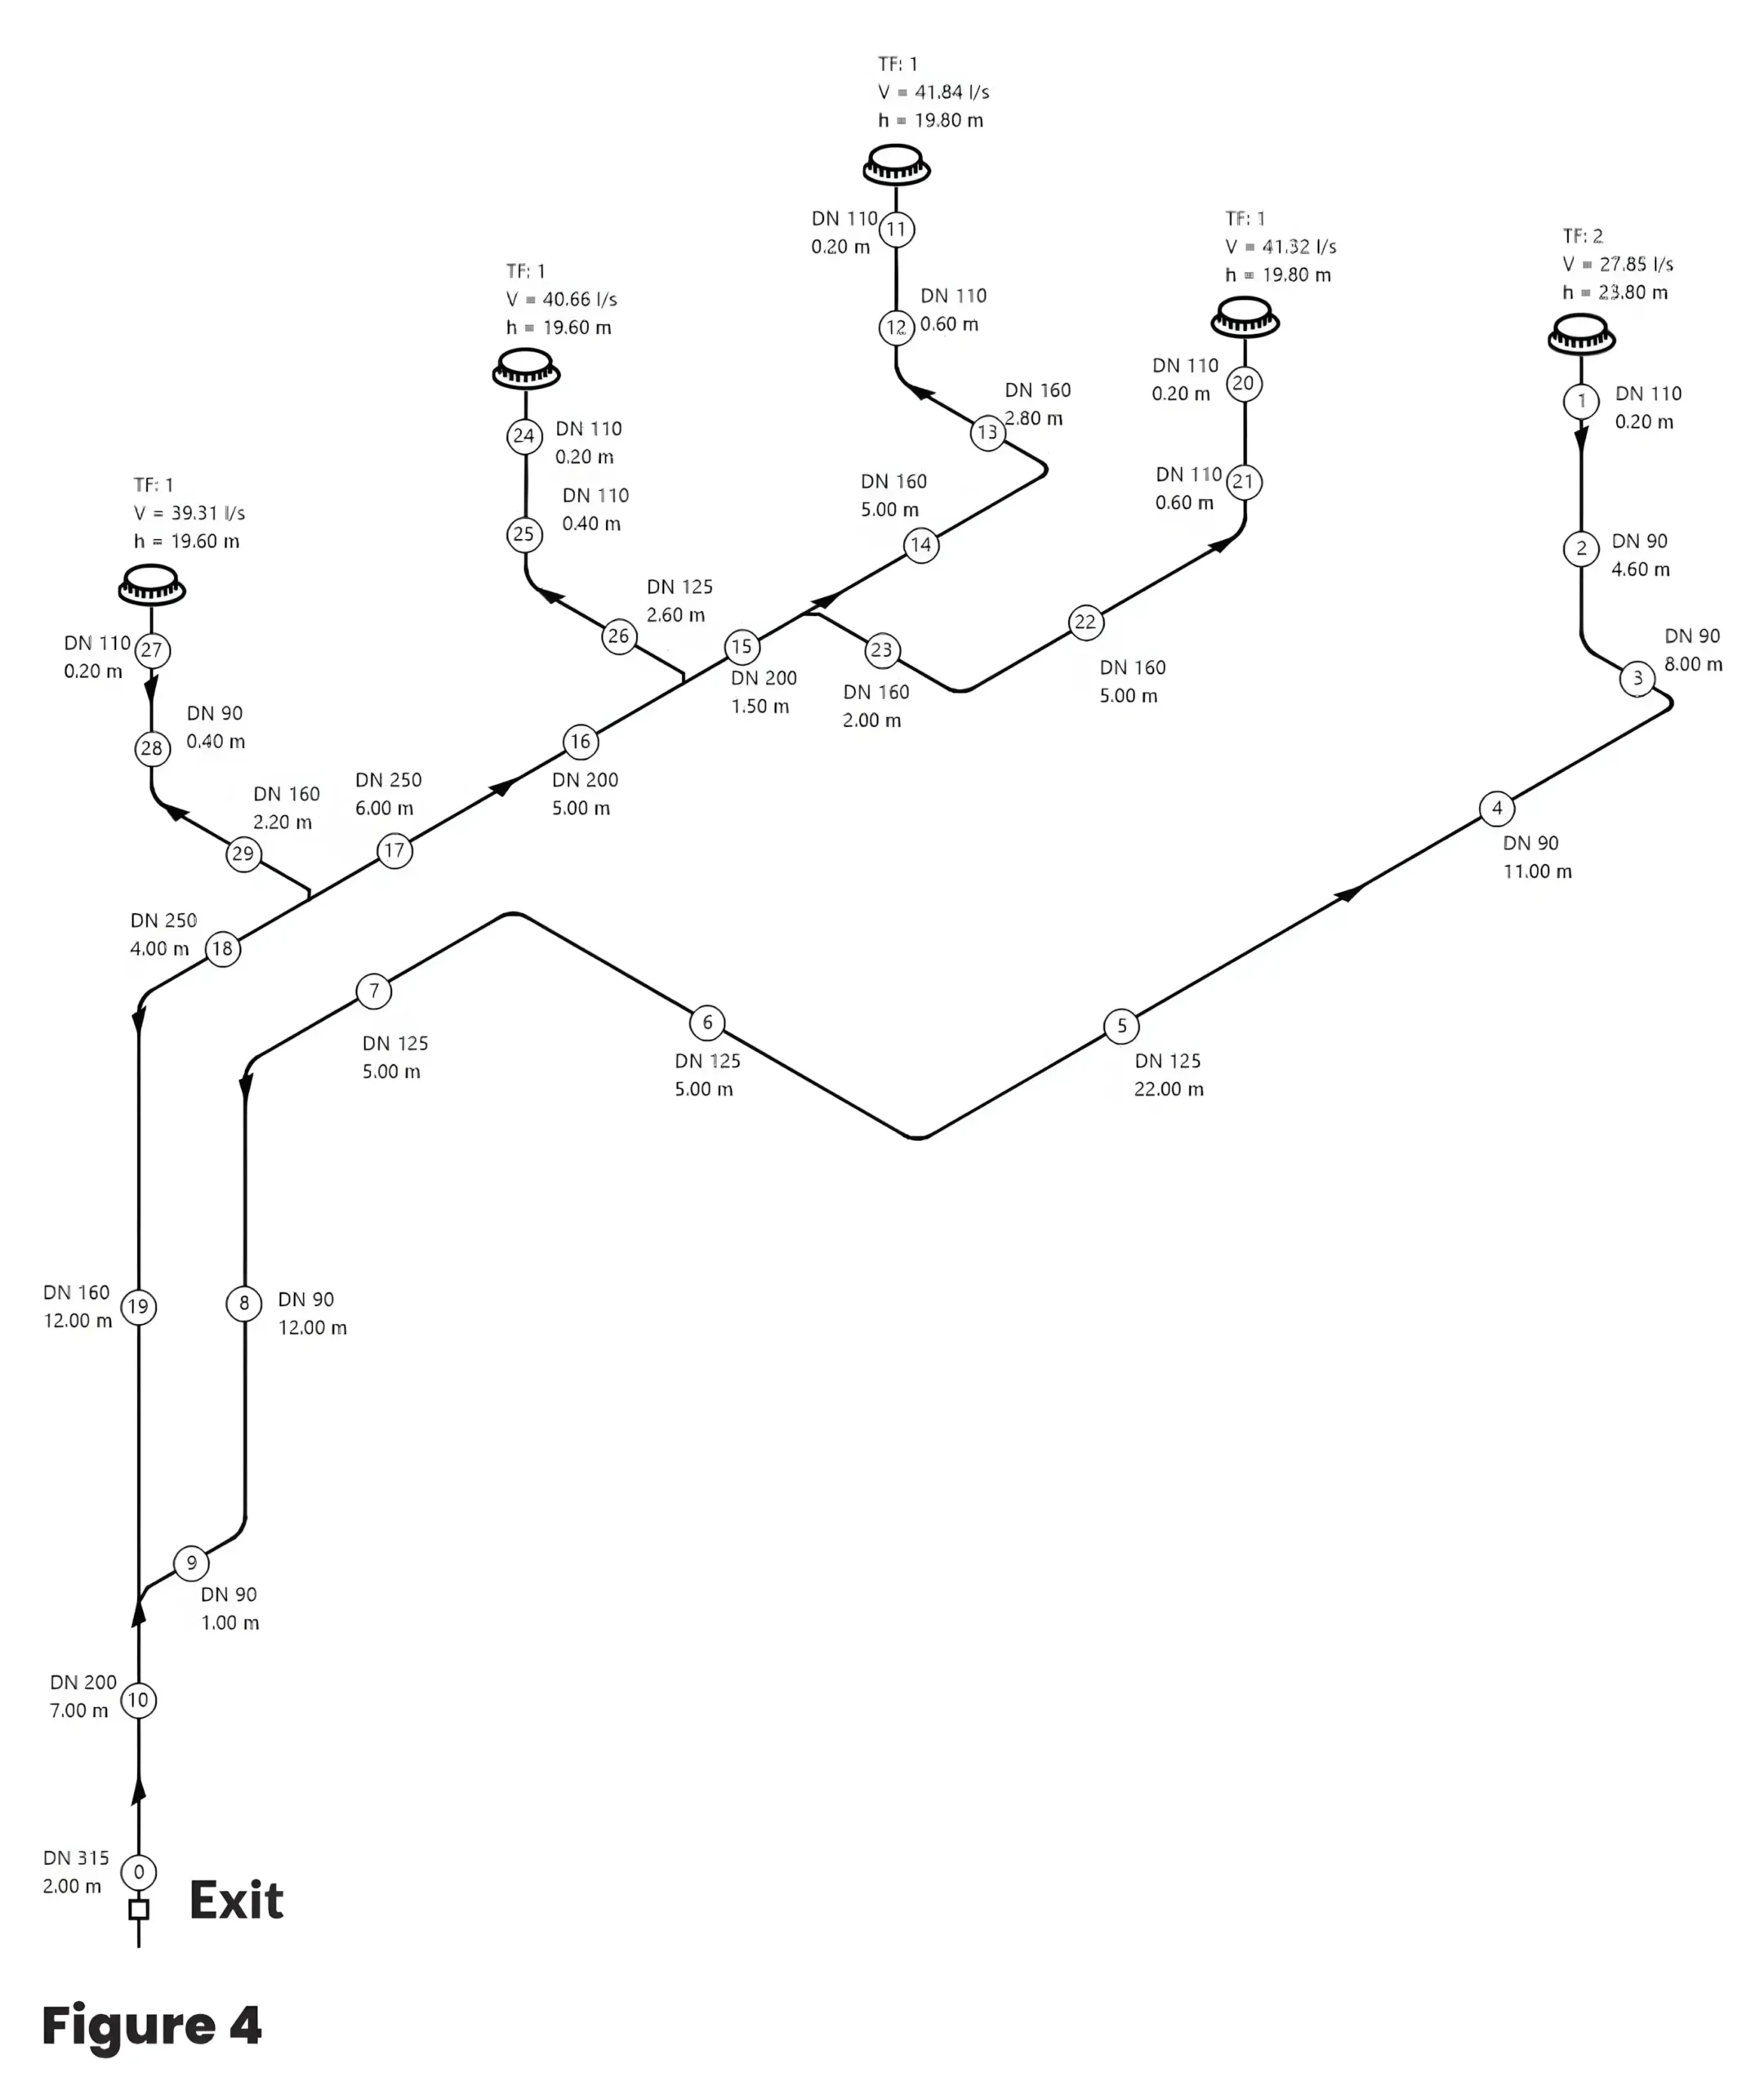
The supplied project example calculates flow rates, velocities and static pressures at critical points along every flow path to the exit, allowing the design team to verify safety and siphonic action.
| Minimum Velocity [m/s] | 2.67 |
| Maximum Velocity [m/s] | 7.14 |
| Exit Velocity [m/s] | 2.88 |
| Total Area [m2] | 1670.15 |
| Total Maximum Flowrate Required / Designed [l/s] | 186.89/ 190.98 |
| Rainfall (l/(s*ha)) | 1,119.00 | |
|
Roof Segment |
Coefficient of Discharge |
Rainfall Collection Area (m2) |
|---|---|---|
| 1 | 1.0 | 1,432.00 |
| 2 | 1.0 | 238.15 |
| C/D: 2 x 45° | ||
| 2 x 45° | ||
| Flow Path | Roof Segment | A (mbar) | Nominal (L/s) | Actual (L/s) | Actual (%) | Length (m) | Roof Outlet Height (m) |
|---|---|---|---|---|---|---|---|
| 1 | 2 | -0.18 | 26.65 | 27.85 | 105% | 75.80 | 23.80 |
| 11 | 1 | 0.09 | 40.06 | 41.84 | 104% | 44.10 | 19.80 |
| 20 | 1 | 0.12 | 40.06 | 41.32 | 103% | 43.30 | 19.80 |
| 24 | 1 | 0.09 | 40.06 | 40.66 | 101% | 37.20 | 19.60 |
| 27 | 1 | 0.10 | 40.06 | 39.27 | 98% | 25.80 | 19.60 |
| Flow Path | Roof Segment | A (mbar) | Nominal (L/s) | Actual (L/s) | Actual (%) | Length (m) | Roof Outlet Height (m) |
|---|---|---|---|---|---|---|---|
| 1 | 2 | -0.18 | 26.65 | 27.85 | 105% | 75.80 | 23.80 |
| 11 | 1 | 0.09 | 40.06 | 41.84 | 104% | 44.10 | 19.80 |
| 20 | 1 | 0.12 | 40.06 | 41.32 | 103% | 43.30 | 19.80 |
| 24 | 1 | 0.09 | 40.06 | 40.66 | 101% | 37.20 | 19.60 |
| 27 | 1 | 0.10 | 40.06 | 39.27 | 98% | 25.80 | 19.60 |
Rainfall Capacity Based on Project Location
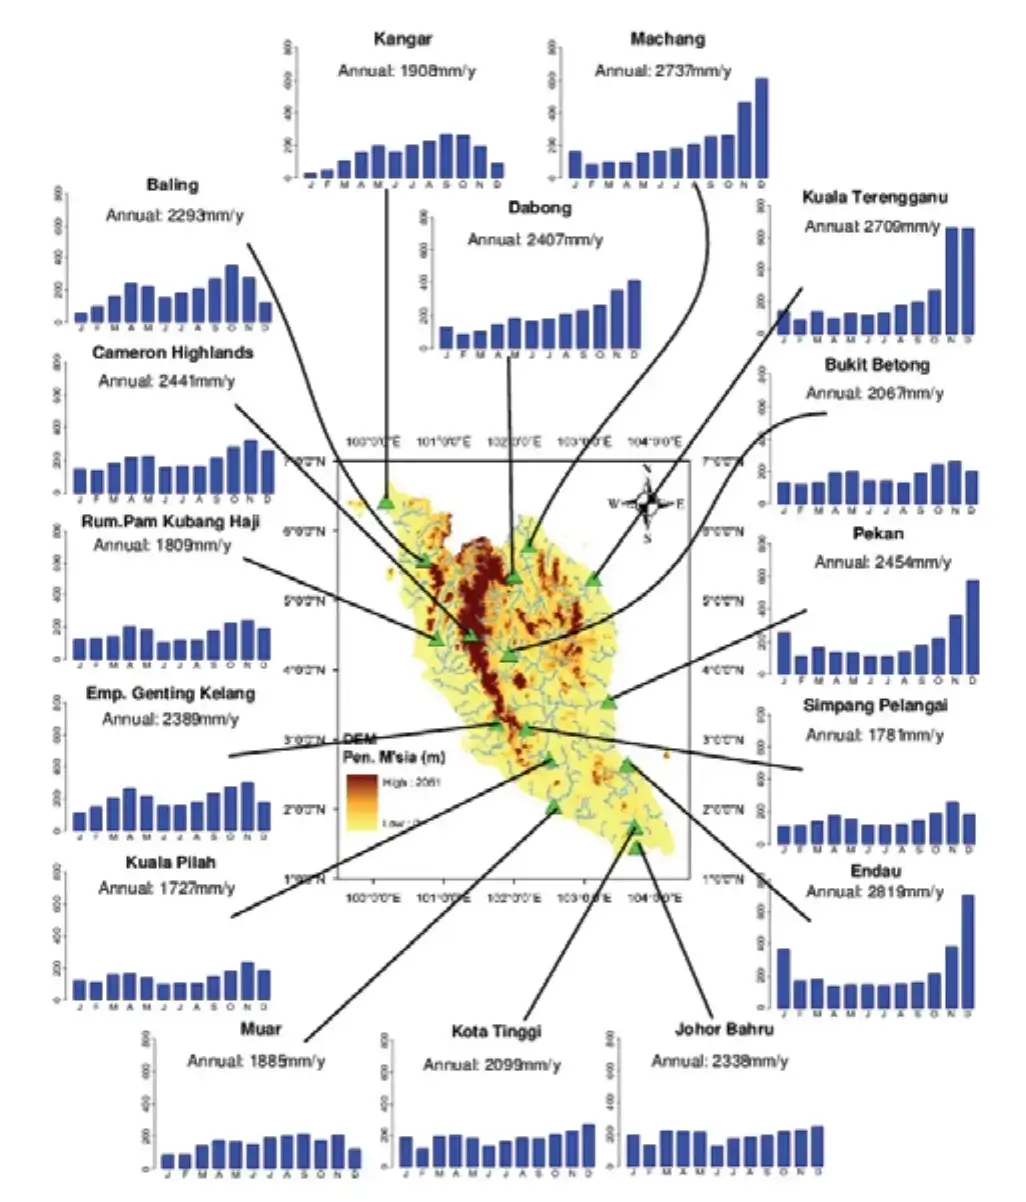
The supplied page states that Chezy bases design rainfall intensity on the nearest meteorological station data from the project site, extracted from MSMA 2nd Edition 2012.
Chezy Design Basis Stated in the Source
The siphonic design generally takes a 100-year return period rainfall with the maximum intensity for a 5-minute rainfall duration. The page also states that the system may alternatively be designed according to client requirements.
1:100-year storm: the source defines this as a rainfall event with a 1/100, or 1%, probability of occurring within any one-year period.
Roof Catchment Calculation Methods
The supplied technical pages distinguish freely exposed roofs from roofs affected by adjacent vertical surfaces and wind-driven rain.
Flat Roof
For a flat roof with a freely exposed horizontal surface the effective catchment area is equal to the plan are of the area to be drained.
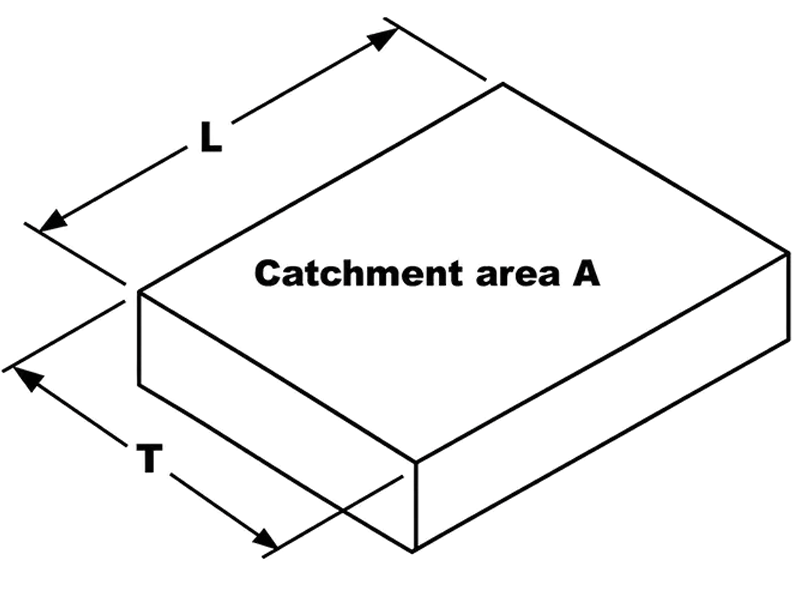
Catchment Area
A = L × TAll dimensions in linear metres.
Dual Pitch Flat Roof
For a dual pitch flat roof, split the roof into discrete areas to isolate the catchment areas as shown:
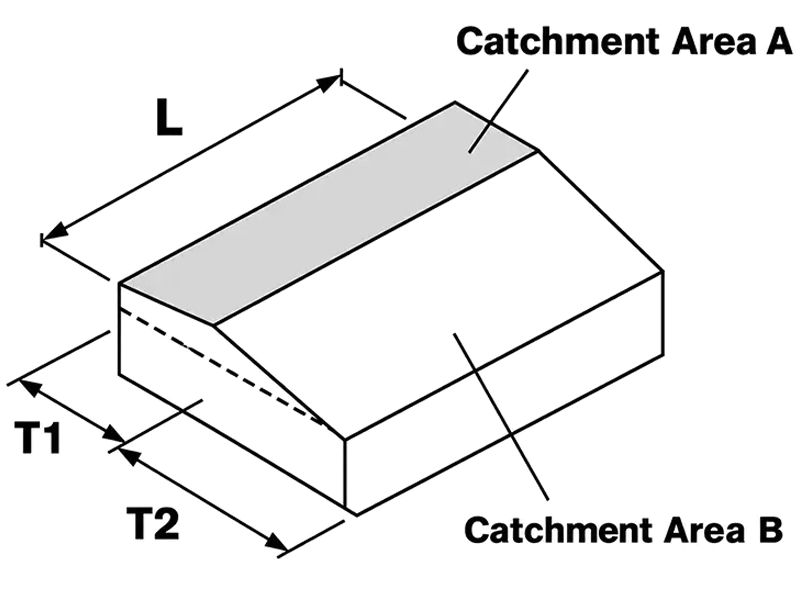
For a dual pith flat roof, split the roof into discreate areas to isolate the catchment areas shown:
Catchment Area
A = L × TB = L × T2 All dimensions in linear metres.
Adjacent Vertical Surfaces
Flat roofs that are adjacent to vertical walls and/or glazed surfaces will be subject to an increased hydraulic load due to the effects of wind driven rain against these vertical surfaces and subsequently running off onto the roof.
Flat Roof with One Adjacent Vertical Wall
For a flat roof exposed to a single wall, assume the effective catchment areas to be half the exposed vertical area of the wall.
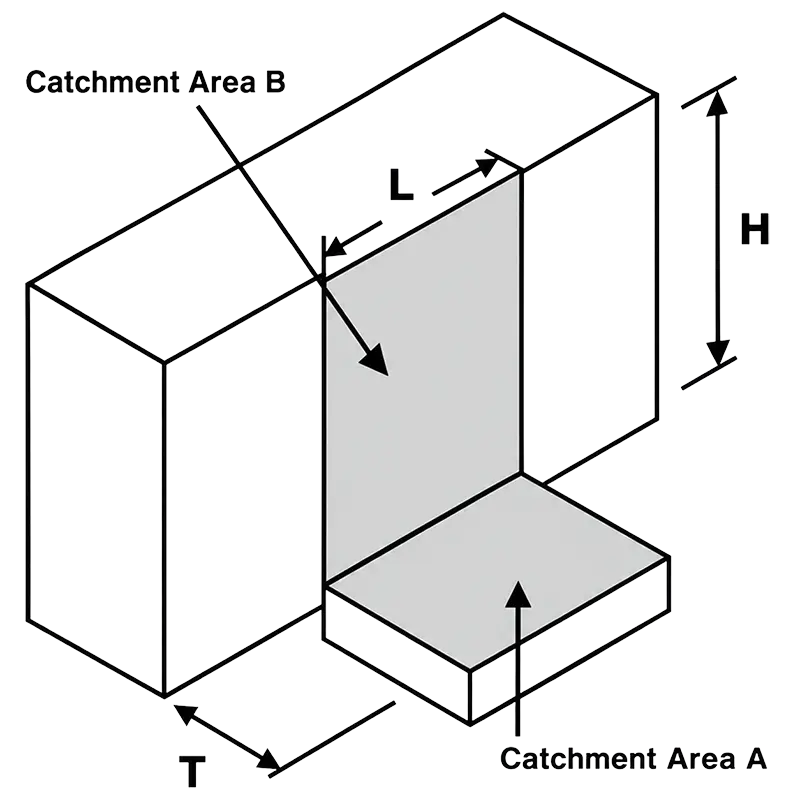
Catchment Area
A = L × T
Catchment Area
B = L × H / 2
Total Catchment Area
= L (T + H / 2) All dimensions in linear metres.
Flat Roof With Two Adjacent Vertical Walls
Similarly, for a flat roof exposed to two or more vertical walls forming an angle or bay, the assumed resulting wind direction requires that the combined areas of the walls should be considered together.
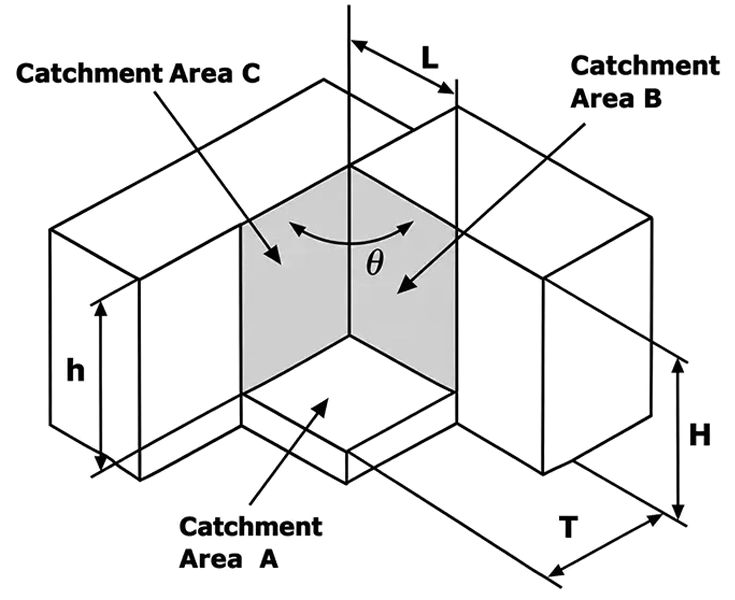
Catchment Area
A = L × T
Catchment Area
B = L × H / 2
Catchment Area
C = T × h / 2
Total Catchment Area
A + ½ √(B² + C² − 2BC cos θ) All dimensions in linear metres, angles in degrees.
Quantity of Rainwater Runoff, Q
The design rainfall quantity used for steady-state hydraulic calculations is based on rainfall intensity, effective catchment area and the run-off coefficient.
Q = r × A × C
Q = rate of flow in L/s
r = rainfall intensity in L/(s·m²)
A = effective catchment area in m²
C = run-off coefficient; the supplied page states 1.0 unless national or local regulations and practice state otherwise, dimensionless
Our engineers use the following guidelines for the run-off coefficients “C” of various roof types:
| Type of Roof | Run-Off Coefficient C |
|---|---|
| Sheet roof with slope > 3° | 1.0 |
| Sheet roof with slope < 3° | 0.8 |
| Gravel roof | 0.5 |
| Intensive green roof | 0.3 |
Types of Gutters Used on Buildings
The supplied technical page identifies four principal gutter arrangements: eaves, parapet, boundary-wall and valley gutters.
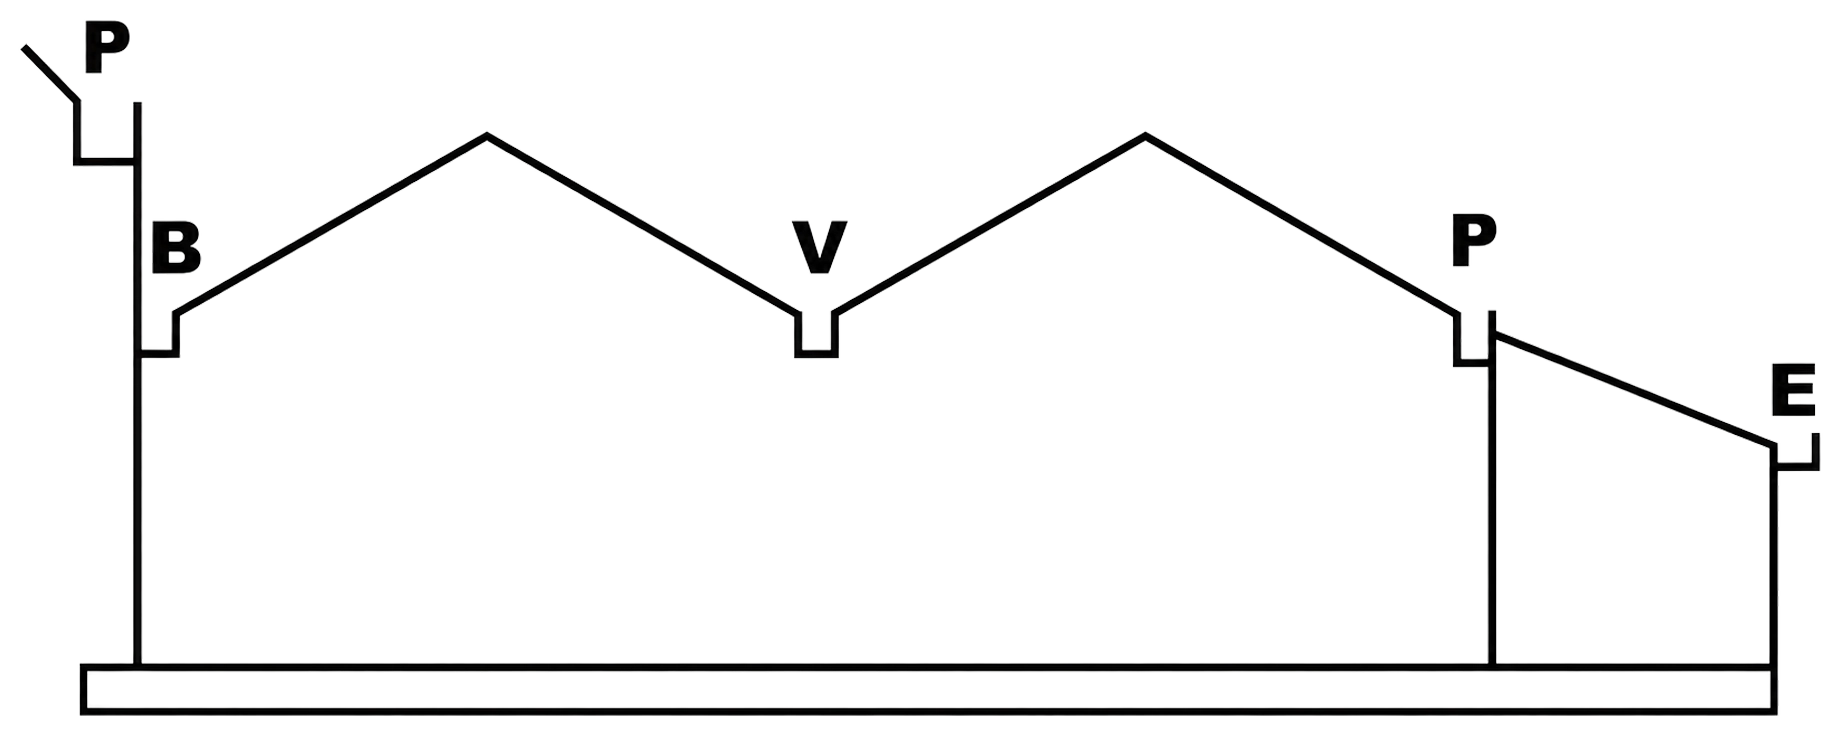
Externally fixed to a building and able to overflow along its length away from the face of the building.
Located around the building perimeter, either with a higher outer edge or behind a parapet or fascia.
Geometrically similar to parapet gutters but typically located across the width of a wall.
Internal gutter located along the valley of multi-gabled buildings formed by two roofs or catchment areas.
Gutter Shapes & Capacity Design Parameters
The source diagram defines the key dimensions used in gutter capacity calculations for rectangular and trapezoidal gutter forms.
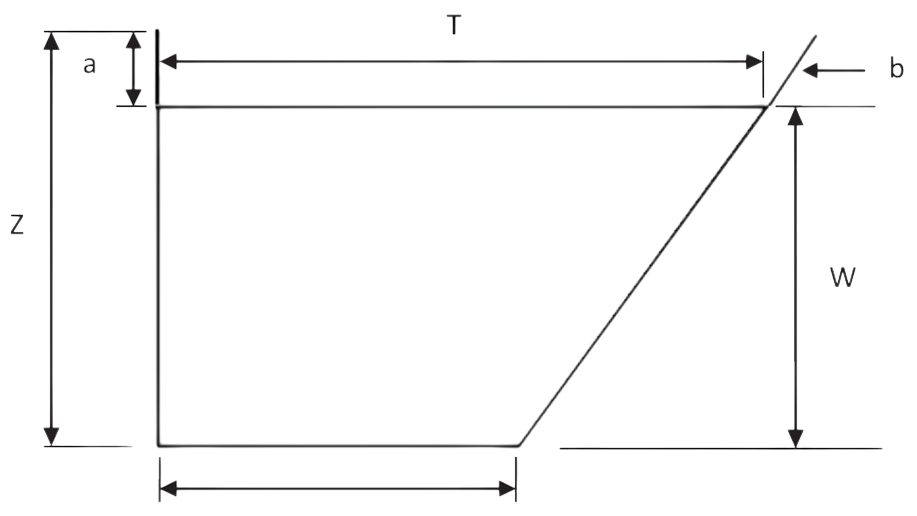
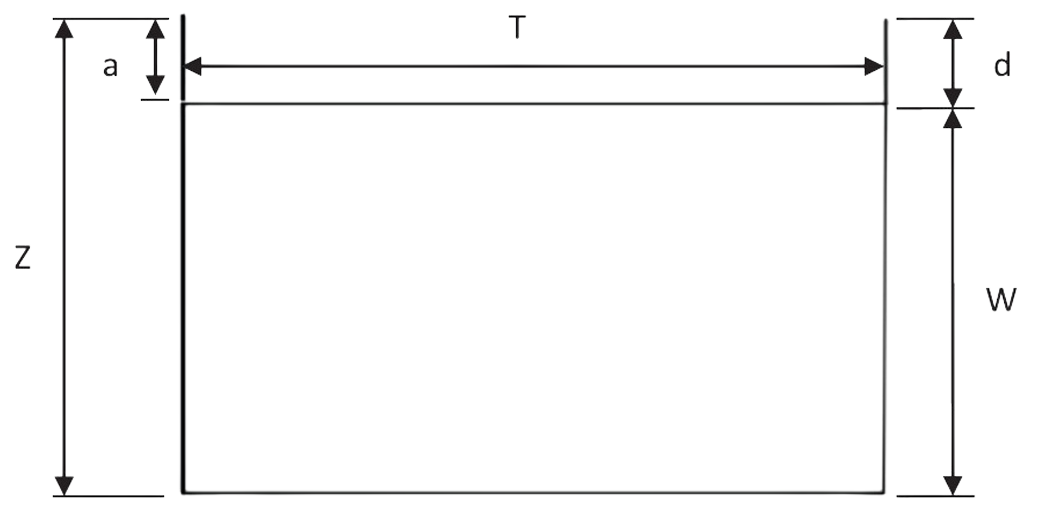
Extensions of the sides of valley gutters do not form part of the gutter.
Spillover level
Width at designed water line
Depth below designed water line
Hydraulically Short & Long Gutter Calculations
The source defines a gutter as hydraulically short when drainage length L is not more than 50 times the maximum design depth W. If L is greater than 50W, it is termed hydraulically long.
A) Semicircular or Similar Eaves Gutters
Hydraulically Short (L < 50W)
The nominal flow capacity, QN (in I/s) is determined from the following equation:
QN = 2.78 × 10⁻⁵ A1.25
Where A (in mm2) is the cross sectional area of water in the gutter when it is filled to its overspill level.
Having determined the nominal flow capacity, QN (in l/s).
The design capacity Q (in I/s) is:
Q = 0.9 QN I/s
The coefficient 0.9 converts the nominal capacity to design capacity (flow capacity).
Hydraulically Long (L > 50W)
The design capacity, Q, is:
Q = 0.9 F QN I/s
QN (in I/s) is the nominal capacity
Factor F allows for the effects of gutter length if the gutter is hydraulically long
F = 1 − (0.2 / 150)(L/W − 50); 50 < L/W ≤ 200
Or
F = 0.8 − (0.2 / 300)(L/W − 200); 200 < L/W ≤ 500
B) Rectangular, Trapezoidal or Similar Eaves Gutters
Hydraulically Short (L < 50W)
The nominal flow capacity, QN (l/s) having a flat sole is:
where
- A (in mm2) is the cross sectional area of water in the gutter when it is filled to its overspill level.
-
The factor FD = 1 for square gutter. For other shapes in this category:FD = ( W T )0.25
-
The factor FS depends on the shape of the gutter.
FS = 1 for square gutters.
For trapezoidal or similar shapes:FS = 0.8943 + 0.2013 ( S T ) − 0.0965 ( S T )2
Having determined the nominal capacity, QN, the design capacity, Q (in l/s) is:
The factor 0.9 converts the nominal capacity into design capacity.
Hydraulically Long (L > 50W)
Having determined the nominal capacity QN (in l/s) from above, the design flow capacity, Q (in l/s), for hydraulically long gutters is:
QN (in l/s) is the nominal capacity
Factor F allows for the effects of gutter length if the gutter is hydraulically long
Or
Design Method For Non Eaves Gutters
The design method is based on the same hydraulic principles earlier with eaves gutters, over topping of gutters area to be prevented during storms. Free board allowances, area to be provided above the maximum designed depth of water flow in the gutters are as follows (refer to figure 6):
| Overall Depth of Gutter, Z (mm) | Minimum Freeboard, a (mm) |
|---|---|
| Less than 85 | 25 |
| 85–250 | 0.3 Z |
| Greater than 250 | 75 |